Custom Reports
Users are able to assemble a wide variety of model input, results, graphs, etc. in a customized report. This report can be transmitted to recipients in a number of formats. The report generator woks best if any scenarios, selection sets, graphs, etc. have already been created before entering the Custom Report manager.
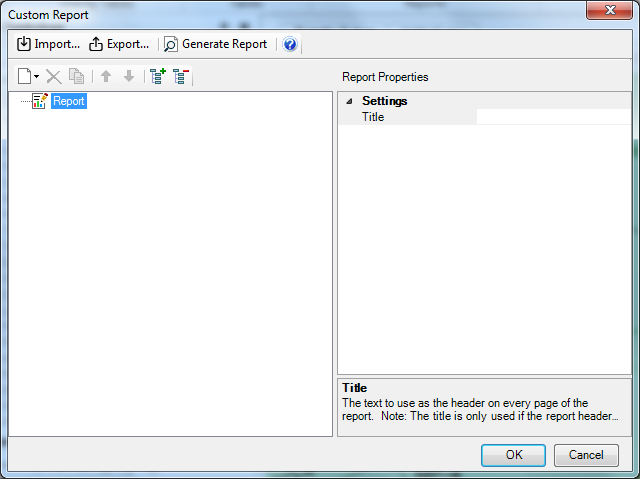
To start a custom report, the user selects Reports > Custom Report or in the Reports tab in the Reports group of the ribbon. The following dialog opens.
Top Row Buttons – The top row of buttons in the Custom Report manager enables the user to manage the overall report. If the user had previously exported a custom report, the report format can be retrieved by selecting the Import button. The behavior of the buttons is as follows:
- Import – opens a dialog where the user can import a previously defined report.
- Export – opens a dialog where the user can save the current report as a .rptx file. The default location is C:\Users\[username]\Documents\Bentley\WaterGEMS
- Generate Report – produces a Preview of the report for which the user can perform any number of steps including viewing, printing, saving as described in help topic Print Preview Window. The report can be exported into a variety of formats including pdf, html, mht, rtf, csv, excel, text and image. In the preview window, the user can also change paper size, orientation and margins.
Second Row Buttons – enable the user to set up the individual Report Sections in the report. Initially, all that is shown is the Report element type and the only entry the user can specify is the Title of the report in the right pane.
- New –enables the user to select the next report section that can be added to the report. This can also be done by right clicking Report and selecting Add.
- Delete – enables the user to delete the highlighted Report Section.
- Duplicate – enables the user to copy a Report Section. This can be a quick way to include a Flex Table at one time step when it has already been set up for another time step.
- Shift-up and Shift down – enables the user to move a Report Section forward and backward in the report. This can be especially helpful if a user wants to insert a page break to help improve the report. Adding a page break adds the break to the end of the report and shirt-up can be used to move it to a preferred location.
- Expand and Collapse – enable the user to expand or collapse the tree view in the left pane.
- OK button closes the Custom Report manager and saves the report.
- Cancel button closes report manager but does not save the changes made since the report was last opened.
There are several types of sections that can be inserted into the report. The control that a user has over the sections depends on whether the sections follow a Scenario divider. If a report section is listed before the first scenario, that section can only display previously saved graphs and data tables. If they are listed after a scenario, the user has a great deal of additional control over the report section and any sections will refer to that scenario.
Scenario – is the usually the first type of report section that a user specifies. The user selects the scenario in the right pane after picking Scenario under New in the left pane. The user selects the scenario from a drop down list populated by the existing scenarios. If the user only wants to report on a selection set of model elements, these can be selected from a drop down list labelled Default Selection Sets which contains predefined selection sets. After the scenario is selected, all entries after that will refer to the selected scenario until a new scenario is selected. If the user does not select a scenario and tries to generate a report, then an error message is produced. Selection sets are optional and the default value is <None> which means that all elements are available, except for Flex Tables (see below).
Graph – When the user selects graph, it is possible to either display a pre-existing graph or create a new graph. If the graph is not associated with a scenario, the manager can only select existing graphs as shown below.
If the graph is associated with a scenario, the user can create a graph at this time, by selecting the Graph Type. If the user picks "Graph" then a pre-existing graph must be selected. If the user picks, Element Graph, the user can select an Element and prepare a new graph after selecting the element from the Drawing.
To select a pre-existing graph, click the drop-down for Name and click "<Select Graph…>". You will be prompted with the following dialog:

When a graph is selected, the Select button is automatically enabled. You can either select the node and click Select or you can double-click the graph which will select the graph automatically and close the dialog. Using the ESC key will cancel the selection and close the dialog.
And then select the Field(s) (Property) to graph.
- Width of Page Factor - determines how much of the space between the margins (in percent) is to be used for the graph or table. The default value is 100% and values must be less than or equal to 100%.
- Aspect Ratio - defines the width:height ratio of the graph.
- Alignment - determines the location of the graph within the margin for graphs less than 100% width. The acceptable values are Left, Center and Right justified.
- A graph with 50% width, 1:1 aspect ratio and center alignment, looks like this:

Data Tables – are very similar to graphs in that they are simply the tabular view of the data displayed in a graph. The commands for graphing also apply for data tables. Data Tables are always left justified and the aspect ratio is determined by the size of the table.
Selecting a saved graph works the same way as the graph section.
FlexTables – provide the user with a way to include FlexTable results in a report. When the user creates a FlexTable, it is necessary to specify which of the existing FlexTables is selected and what Selection Set of elements is to be displayed. The default value of <none> is not acceptable. If the user wants to show all of the elements of a given type, it is necessary to create a Selection Set will all elements of that type. There must be at least one element in a Selection Set. When the Override Selection Set property is set to False, the Selection Set specified in the Scenario Report Section is used. When it is set to True, the user must specify the Selection Set to be used. Finally, the time step to be used to populate the flex table must be selected.
The user is required to name specific selection sets and time steps because FlexTables can easily contain thousands of rows and if multiple time steps are chosen, the report can be exceedingly large. Requiring the user to consider exactly what values are important, makes that portion of the Report more focused.
FlexTables can contain a large number of columns which may unnecessarily take up space in the Report. Users may want to create custom flex tables for the report showing only the columns that are of interest. They can do this by creating Custom or Shared Flex Tables (see FlexTable help).
Map View – enables the user to insert a map of the piping network in the report. Before creating a Report Section for a map view, the user must have already created a Named View (see Named Views). If the user has specified a named Symbology Definition, the user can specify it. The default value is the <default> element symbology. If the user wants a map to have a background, it must be displayed when the report is generated.
- Width of Page Factor - determines how much of the space between the margins (in percent) is to be used for the graph or table. The default value is 100% and values must be less than or equal to 100%.
- Alignment - determines the location of the graph within the margin for graphs less than 100% width. The acceptable values are Left, Center and Right justified.
- Border - determines whether a border is placed around the map.
- Time from start - indicates the time for which symbology values are calculated.
Section Titles – enable the user to insert section titles into a report. Whatever is entered on the right pane will appear below the report title on subsequent pages until the next section title is encountered. To stop showing section titles, enter a new section title that is blank.
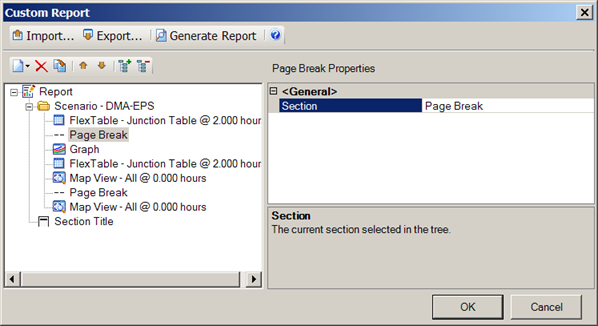
Page Break – enables the user to insert a page break so that the next Report Section begins on a new page. The Shift-up and Shift down arrows can be used to move page breaks.
Blank Line – enables the user to insert a blank line between report sections. This can be used to improve the appearance of the report so that graphs and tables don’t appear to run into one another. The user can specify the number of blank lines in the right pane. The default number is one.
Summary Section – provides the user with access to a number of predefined summary reports. The format of these reports is already set. These include:
- Scenario Summary provides a list of alternatives and calculation options associated with the scenario.
- Hydraulic summary provides a list of hydraulic options used such as friction method, duration and time step size.
- Water quality summary provides a list of water quality inputs. If the scenario is not a water quality scenario, then this section is not included and a warning is written to the log file.
- Network inventory provides a list of each element type and the number of active elements of that type.
- Pressure Pipe inventory provides a list of the length of each size pipe sorted by material type.
- Lateral inventory provides a summary inventory showing the number of active laterals and the total length.
- Transient network inventory provides a list of the number of active transient specific elements by element type.
Report Options - The user can also control headers, footers, fonts, and margins in a separate dialog which can be reached using Report > Report options or the Reports section of the ribbon. See the help for these setting.